

Democrats won. Markets wobbled overnight, then rallied hard. If the last 48 hours have you refreshing your portfolio more than usual, history offers some welcome perspective, and a few smart moves worth making before the year closes.
The first 48 hours: a familiar kind of turbulence
As results confirmed a Democratic “blue wave” in the 2026 midterms, stock futures sold off overnight before reversing. On Wednesday, November 4, the S&P 500 closed up 1.58% and the Dow gained roughly 1,570 points (3%), its best day since April 2025, as investors weighed the prospect of divided government. The 10-year Treasury yield eased to about 4.88%.
This kind of reaction is normal. Markets dislike uncertainty, and an election is a concentrated dose of it. What matters for long-term investors is what tends to happen next.
What history says: 19 for 19
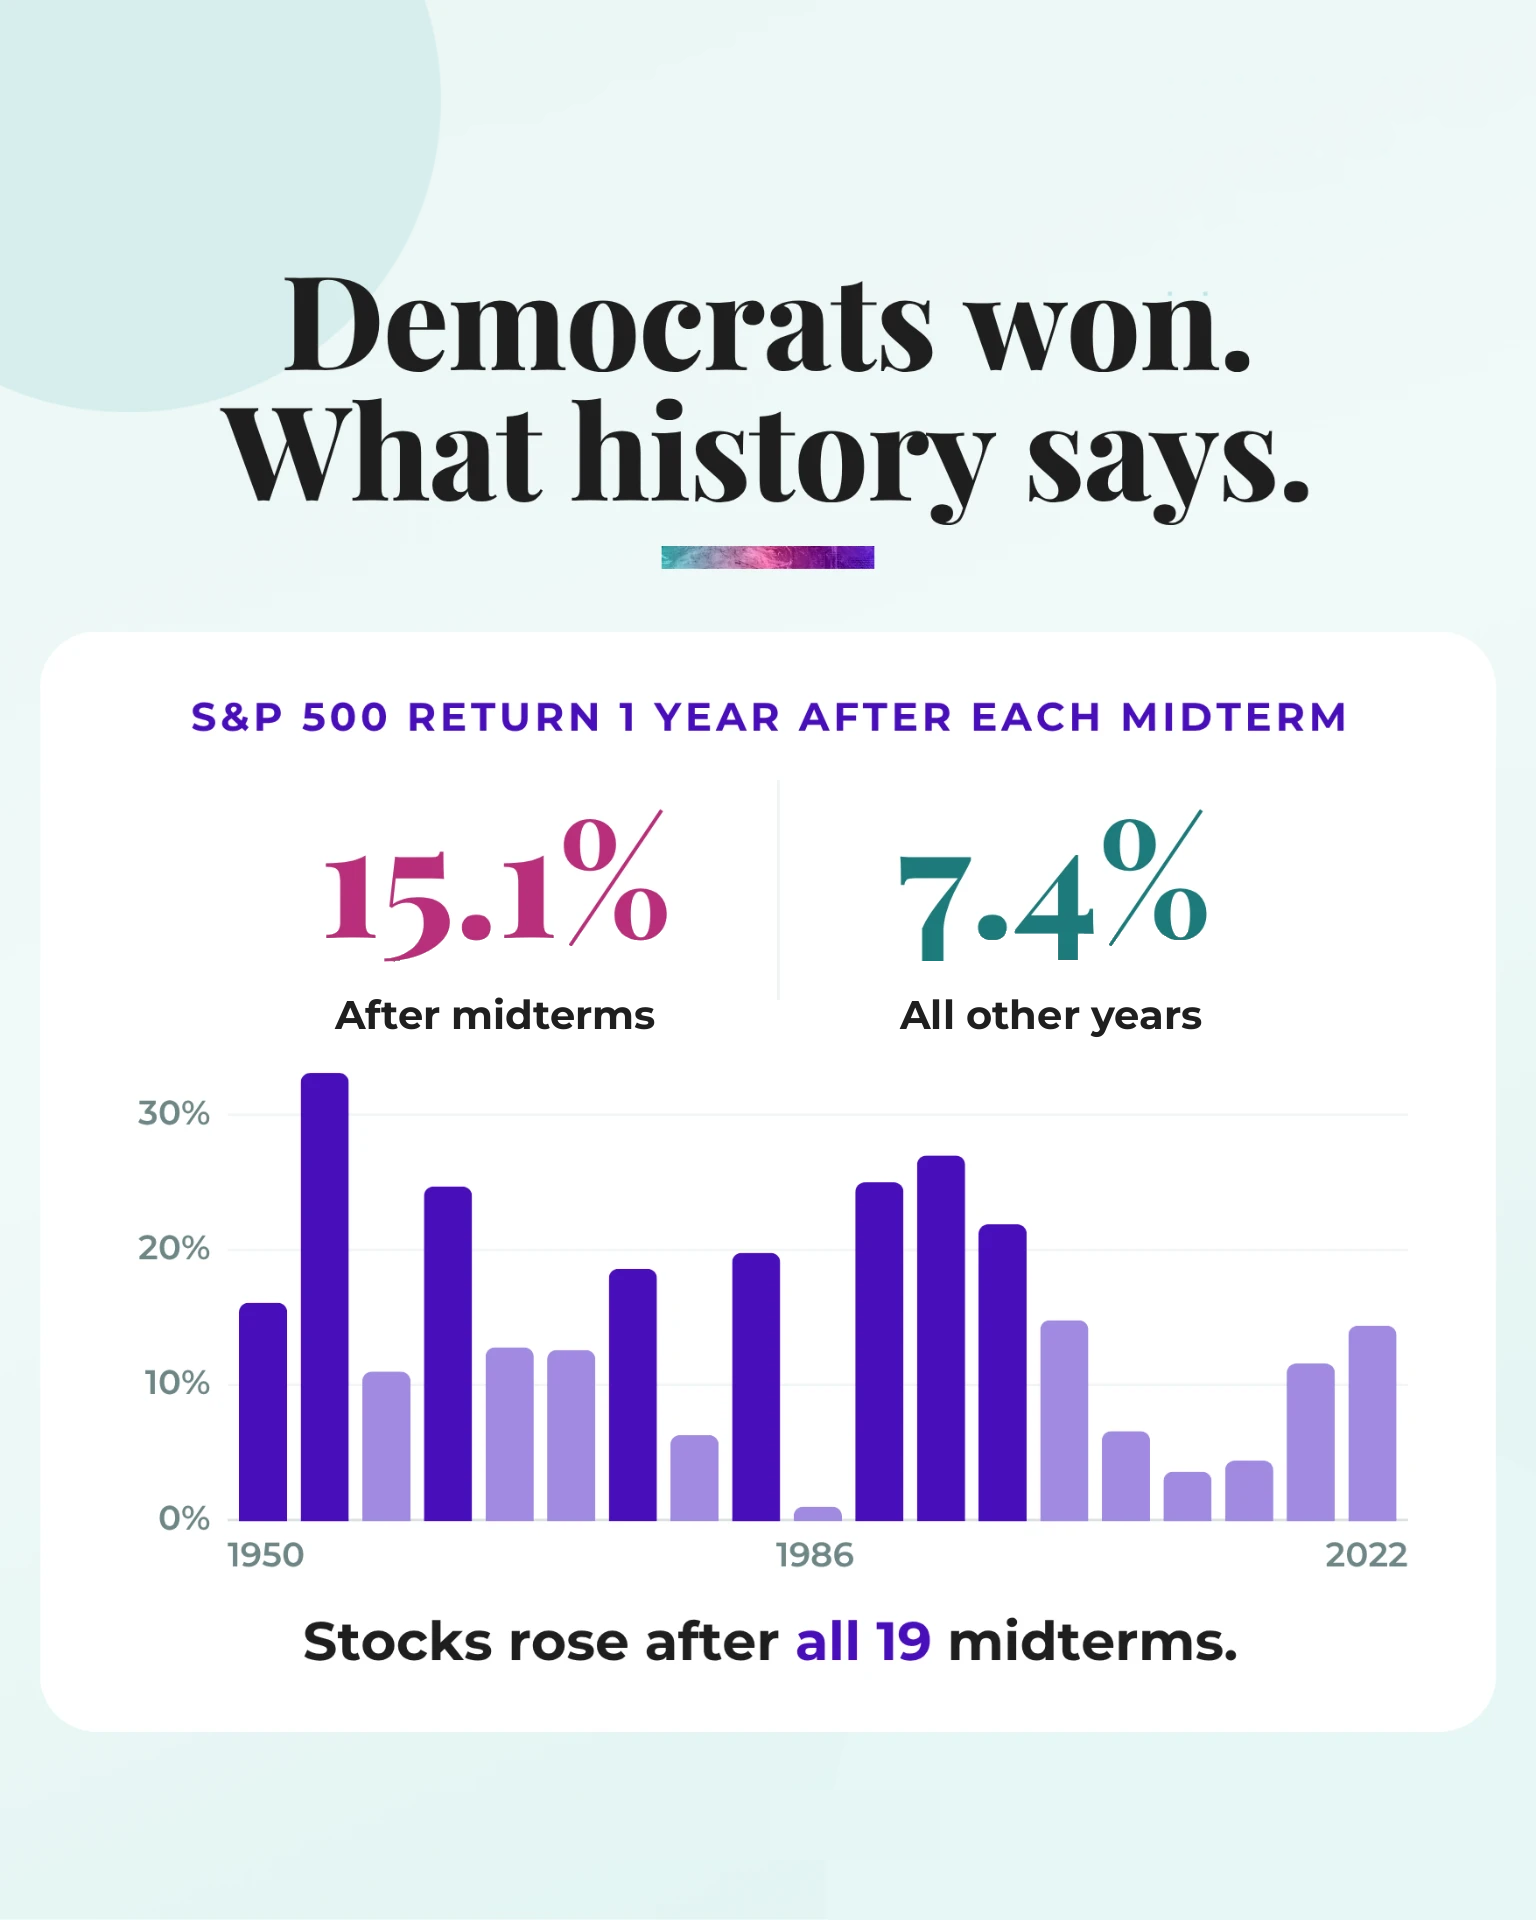
According to Capital Group, the S&P 500 rose in the 12 months after every midterm election from 1950 through 2022. The average one-year price return after midterms was 15.1%, roughly double the 7.4% average in all other years. Once the uncertainty of an election passes, markets have historically been free to refocus on earnings and the economy.
Washington keeps swinging
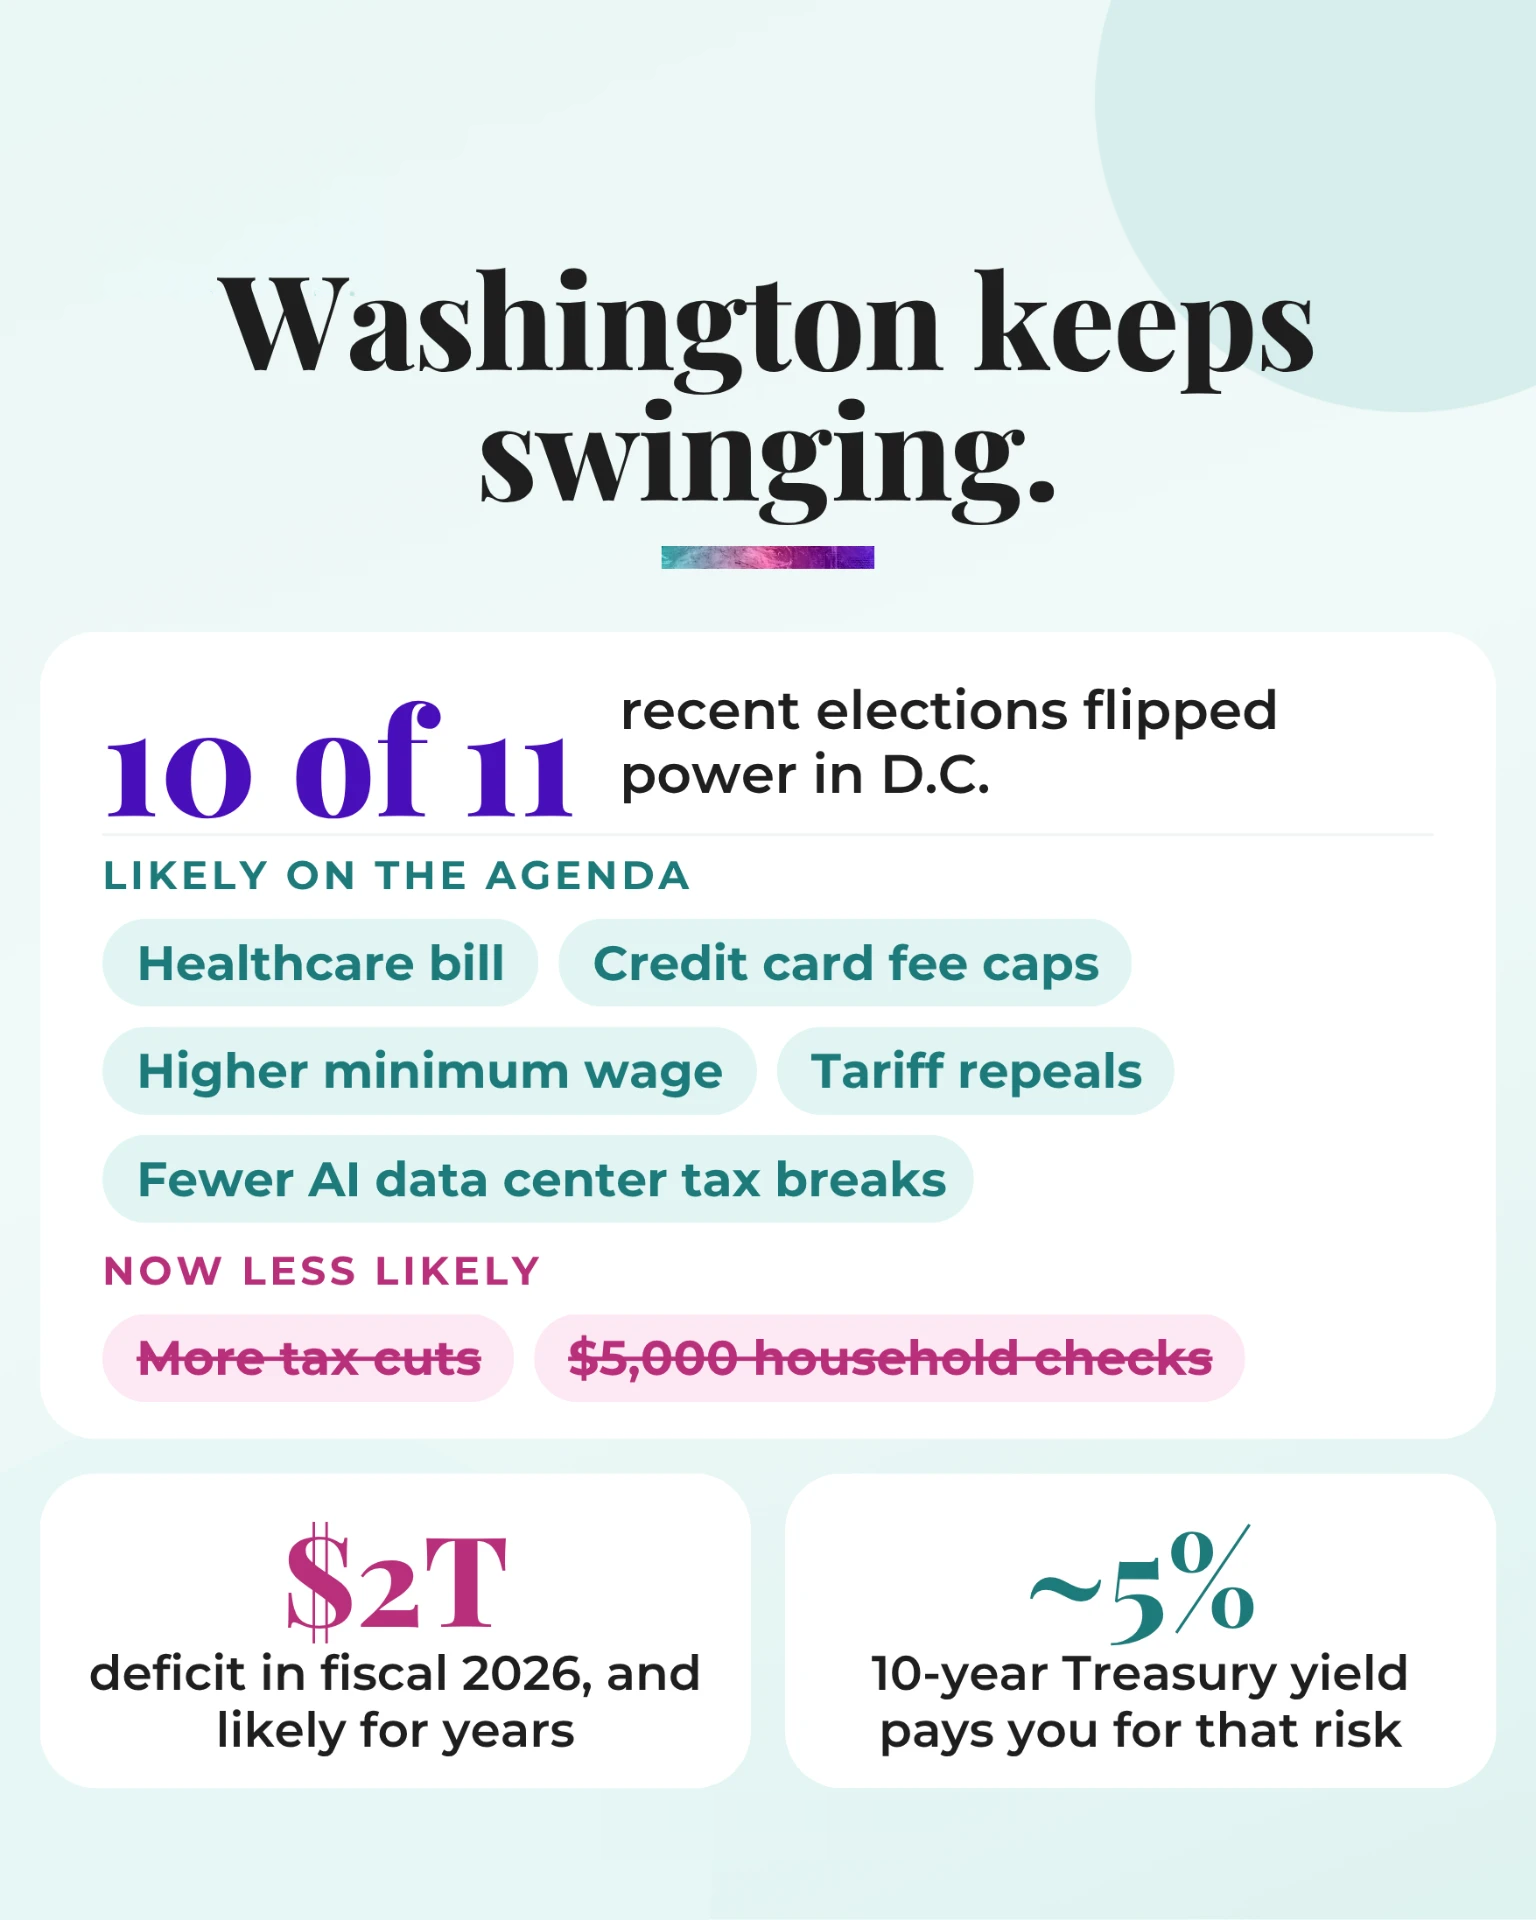
Control of Washington changes hands often: 10 of the last 11 elections flipped power in D.C. A new majority brings a new agenda. Items now likely on the table include a healthcare bill, credit card fee caps, a higher minimum wage, tariff repeals, and fewer tax breaks for AI data centers. Further tax cuts and proposed $5,000 household checks now look less likely.
Meanwhile, the federal deficit reached about $2 trillion in fiscal 2026 and is likely to stay large for years. The upside for savers: a 10-year Treasury yield near 5% pays investors meaningfully for taking on that risk.
Drops are normal. So are recoveries.
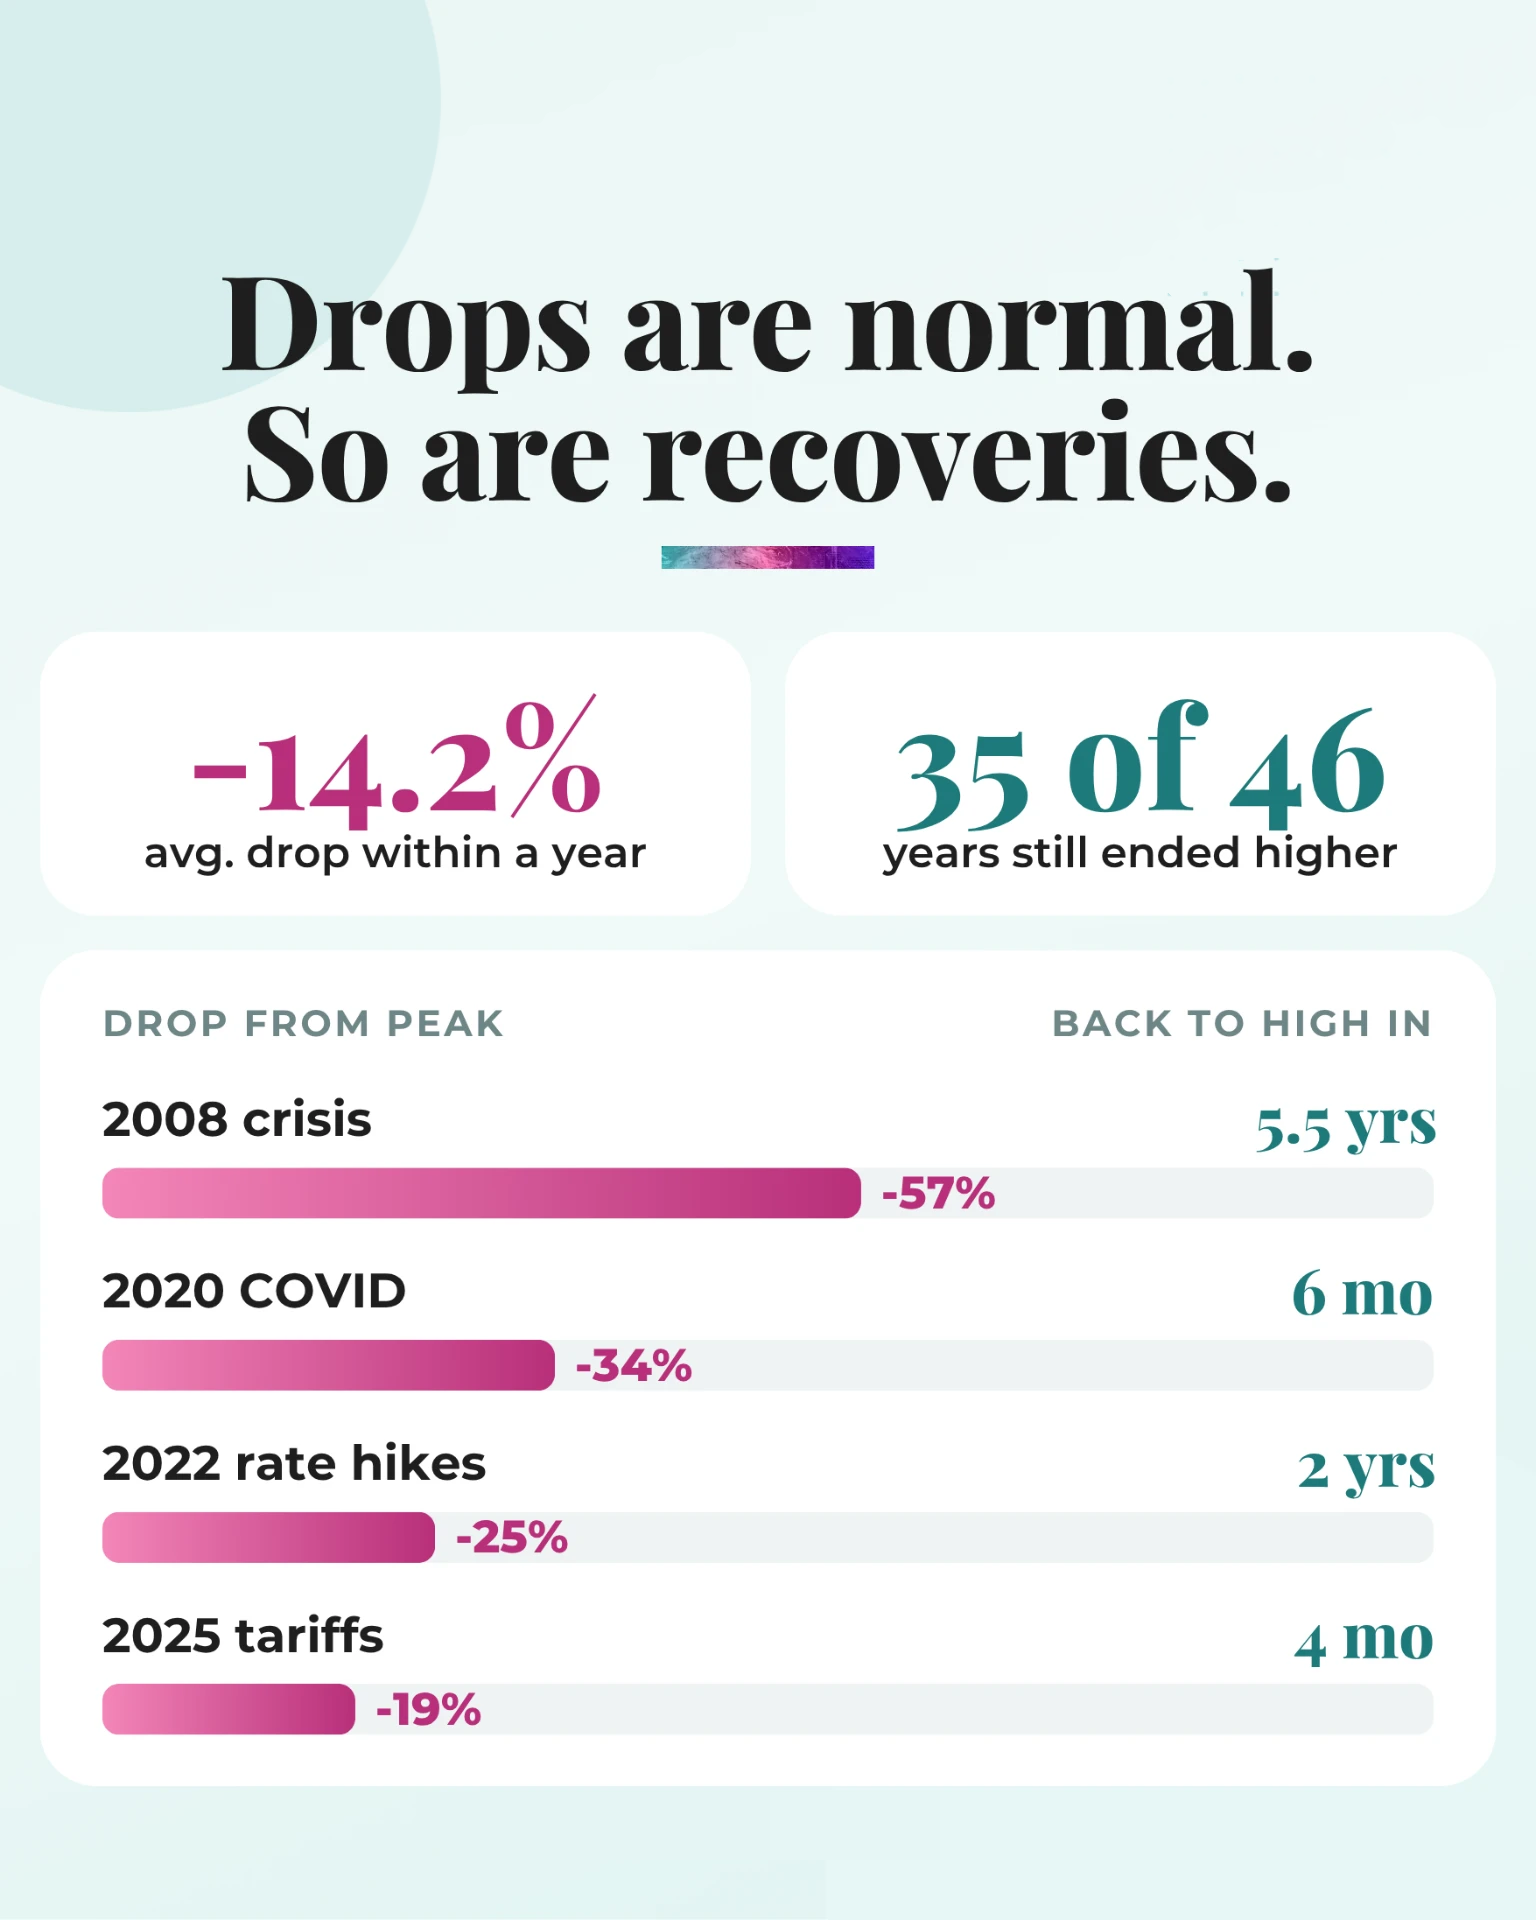
Per J.P. Morgan Asset Management, the S&P 500 has experienced an average intra-year decline of 14.2% since 1980, yet 35 of those 46 years still ended higher. Even severe declines have recovered: the 57% drop of the 2008 crisis took about 5.5 years to regain its prior high, the 34% COVID drop about six months, the 25% decline during the 2022 rate hikes about two years, and the 19% tariff drop in 2025 about four months.
When markets swing, make volatility work for you
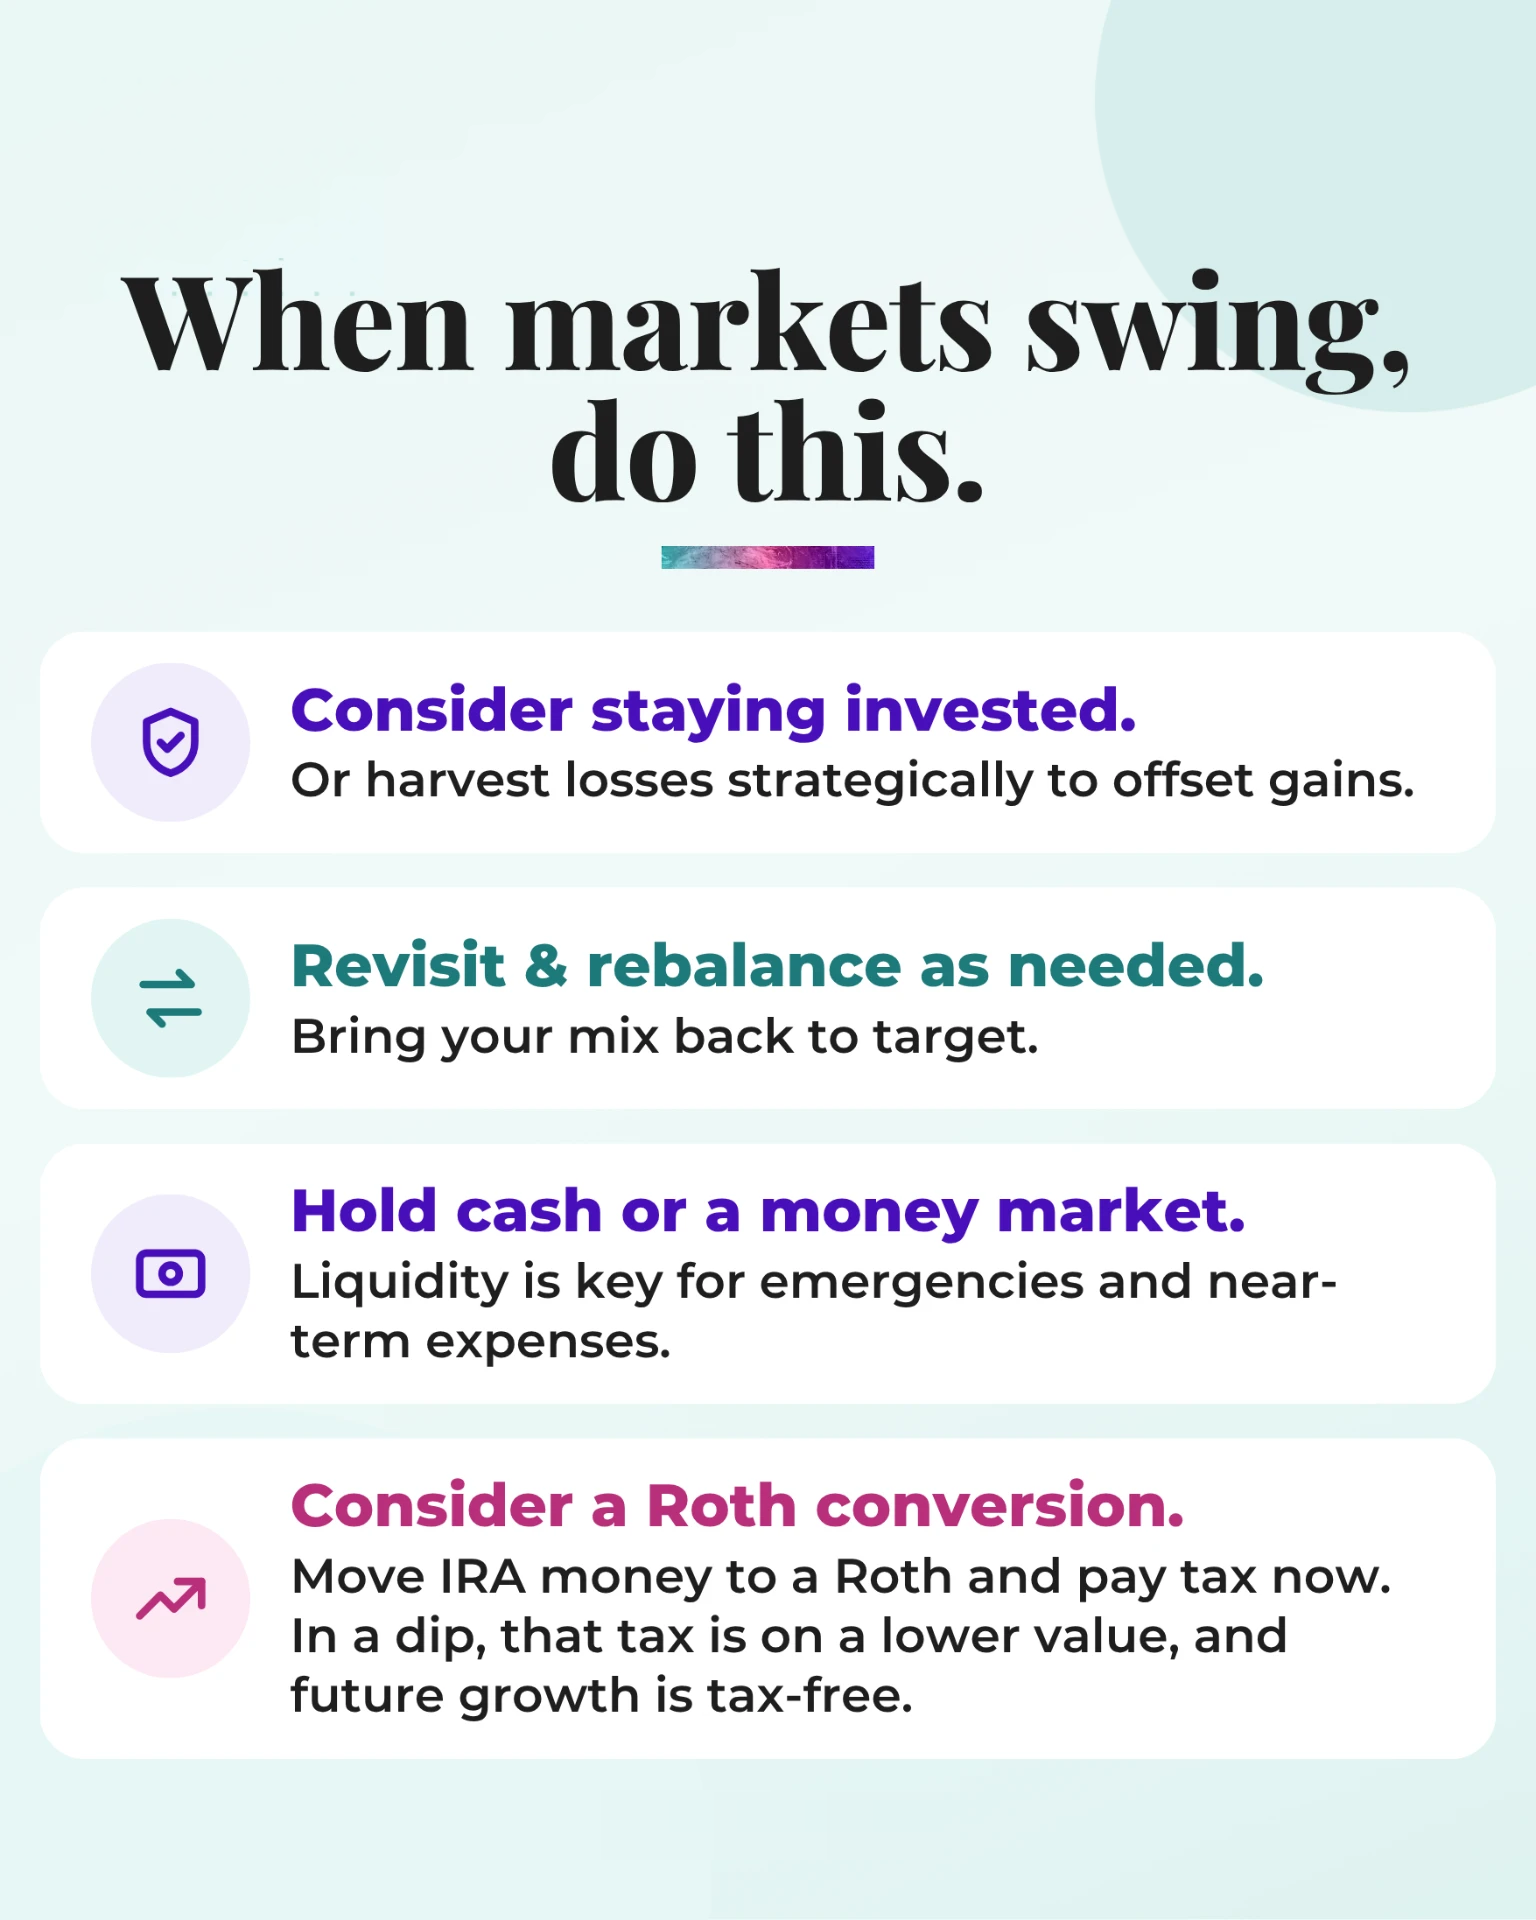
See what tax-smart moves you can make before year end
Loss harvesting, Roth conversions, and contributions all have a December 31 deadline.
Evaluate the opportunities volatility creates
Price swings can open doors for rebalancing and long-term positioning.
Have a plan before the next swing
Election results rarely drive long-term outcomes. Your plan does. If you want a practical starting point, review our year-end tax planning checklist or read why every decade hands investors a reason not to invest. And if the past two days have raised questions, connect with us to schedule a visit.
Sources: Capital Group, “After the 2026 midterms: How will the ‘blue wave’ affect markets?,” Nov. 5, 2026 (S&P 500 price return one year after midterms, 1950 to 2022, via RIMES and S&P Global; election and policy outlook; FY2026 deficit; 10-year yield). J.P. Morgan Asset Management, Guide to the Markets, 2026 (average intra-year decline and annual returns, 1980 to 2025). S&P 500 peak-to-trough declines and recovery to prior high, 2007 to 2025. November 4, 2026 market closes: Business Insider; 10-year yield: J.P. Morgan Asset Management Daily Guide, Nov. 5, 2026. Roth example is hypothetical; conversions are taxable income, so consult a tax professional. Indices are unmanaged and not available for direct investment. Past performance does not guarantee future results. General education, not personalized advice. Header photo: Martin Falbisoner, Wikimedia Commons, CC BY-SA 3.0.