
2026 Market Outlook: Where Smart Investors May Find Opportunity Next
As markets move beyond a narrow rally dominated by Artificial Intelligence, the 2026 Outlook offers a clear message: the next phase of investing will reward diversification, patience, and global thinking. Rather than chasing what’s already crowded, new opportunities will emerge across regions, sectors, and asset classes, as economic conditions evolve.
A Broader Market Story Is Taking Shape
After years of U.S. equity leadership, there are signs that global markets are beginning to rebalance. While AI and mega-cap technology stocks remain influential, investment opportunities are expanding into:
- International and European equities
- Select emerging markets
- Companies outside the most expensive growth segments
This shift may benefit investors willing to look beyond last year’s winners.
Economic Resilience, Not Recession
The 2026 global outlook is cautiously optimistic.
- Moderating but stable U.S. growth
- Improving momentum in Europe
- Continued consumer and corporate resilience despite lingering uncertainty
Rather than a sharp downturn, the base case points toward increasingly uneven, but potentially durable, global expansion. Many economists, however, worry that an economy driven by the wealthiest is not sustainable. Should layoffs worsen and unemployment rise, middle- and lower-income Americans could pull back sharply on spending. However, Trump will likely appoint a new Federal Reserve chair by next May who will be more inclined to cut interest rates. Lower borrowing costs would, in theory, accelerate growth and wages, though it would potentially also worsen inflation.
Strong Returns, Rising Risks: Why Investors Should Brace for 2026 Volatility
- Elevated Stock Valuations (Limited Room for Error): Stocks globally are expensive relative to their historical norms, meaning prices already reflect good news. When price-to-earnings (P/E) ratios are above long-term averages, even small disappointments can trigger sharp sell-offs. If a major U.S. technology company reports earnings that are good but not great, its stock could still fall 15% because investors expect exceptional growth. A slowdown in earnings growth in emerging markets could lead to broad declines, even if economies are expanding.
- Positive economic news may no longer push markets much higher because optimism is already “priced in.” Investors who piled into stocks late in a rally may sell quickly at the very first sign of trouble, amplifying short term market declines. Indexes could stagnate for months as earnings “catch up” to prices, even without a recession.
- Strong Recent Returns Increase Pullback Risk: Double-digit annualized equity returns over the past three years raise the likelihood of consolidation or correction. Markets don't move in straight lines. Strong rallies are frequently followed by pauses or reversals. This is a normal part of investing. A rotation out of high-growth stocks into bonds or defensive sectors could also drag down major indexes.
- Sticky Inflation: Inflation remains higher than central banks would like, limiting their ability to support markets. Persistent inflation can keep interest rates higher for longer, which pressures stock valuations. If U.S. inflation stops falling or rises again, central banks may delay rate cuts, causing equity markets to reprice lower. Continued higher borrowing costs and higher household expenses could continue to hurt housing and consumer spending. Companies then struggle to pass higher costs on to consumers, squeezing profit margins.
- Rising Government Debt Levels: Mounting public debt in the U.S., Europe, and elsewhere increases long-term economic and financial risks. High debt can crowd out private investment and raise concerns about fiscal sustainability. For example: government bond issuance could push yields higher, making stocks less attractive relative to bonds. Governments may eventually raise taxes or cut spending, slowing economic growth. Credit rating concerns or political disputes over budgets could also unsettle financial markets.
- Unanticipated Shocks: Unexpected events disrupt markets, even during positive economic periods. These events are unpredictable and often trigger rapid, emotional, market reactions. For example: Geopolitical conflicts affecting energy supplies, sudden banking or credit stress, natural disasters, or supply-chain disruptions impacting global trade could all impact financial markets.
Market Declines Are a Normal Part of Investing, Not Exceptions.
Investors who are mentally unprepared may panic and lock in losses. A typical 10% correction could occur even in a healthy economy. A 20% bear market may happen without a major crisis, simply due to tightening financial conditions. Volatility spikes can force leveraged investors to sell, worsening declines. The S&P 500 has experienced many corrections of at least 10% historically, roughly every 1.6 years on average since 1950, meaning about once every 1–2 years. Shorter pullbacks (less than 10%) happen more frequently, sometimes multiple times per year.
Here are two hypothetical approaches to volatility: Growth of $10,000 Invested in S&P 500 Index (1950-2024).
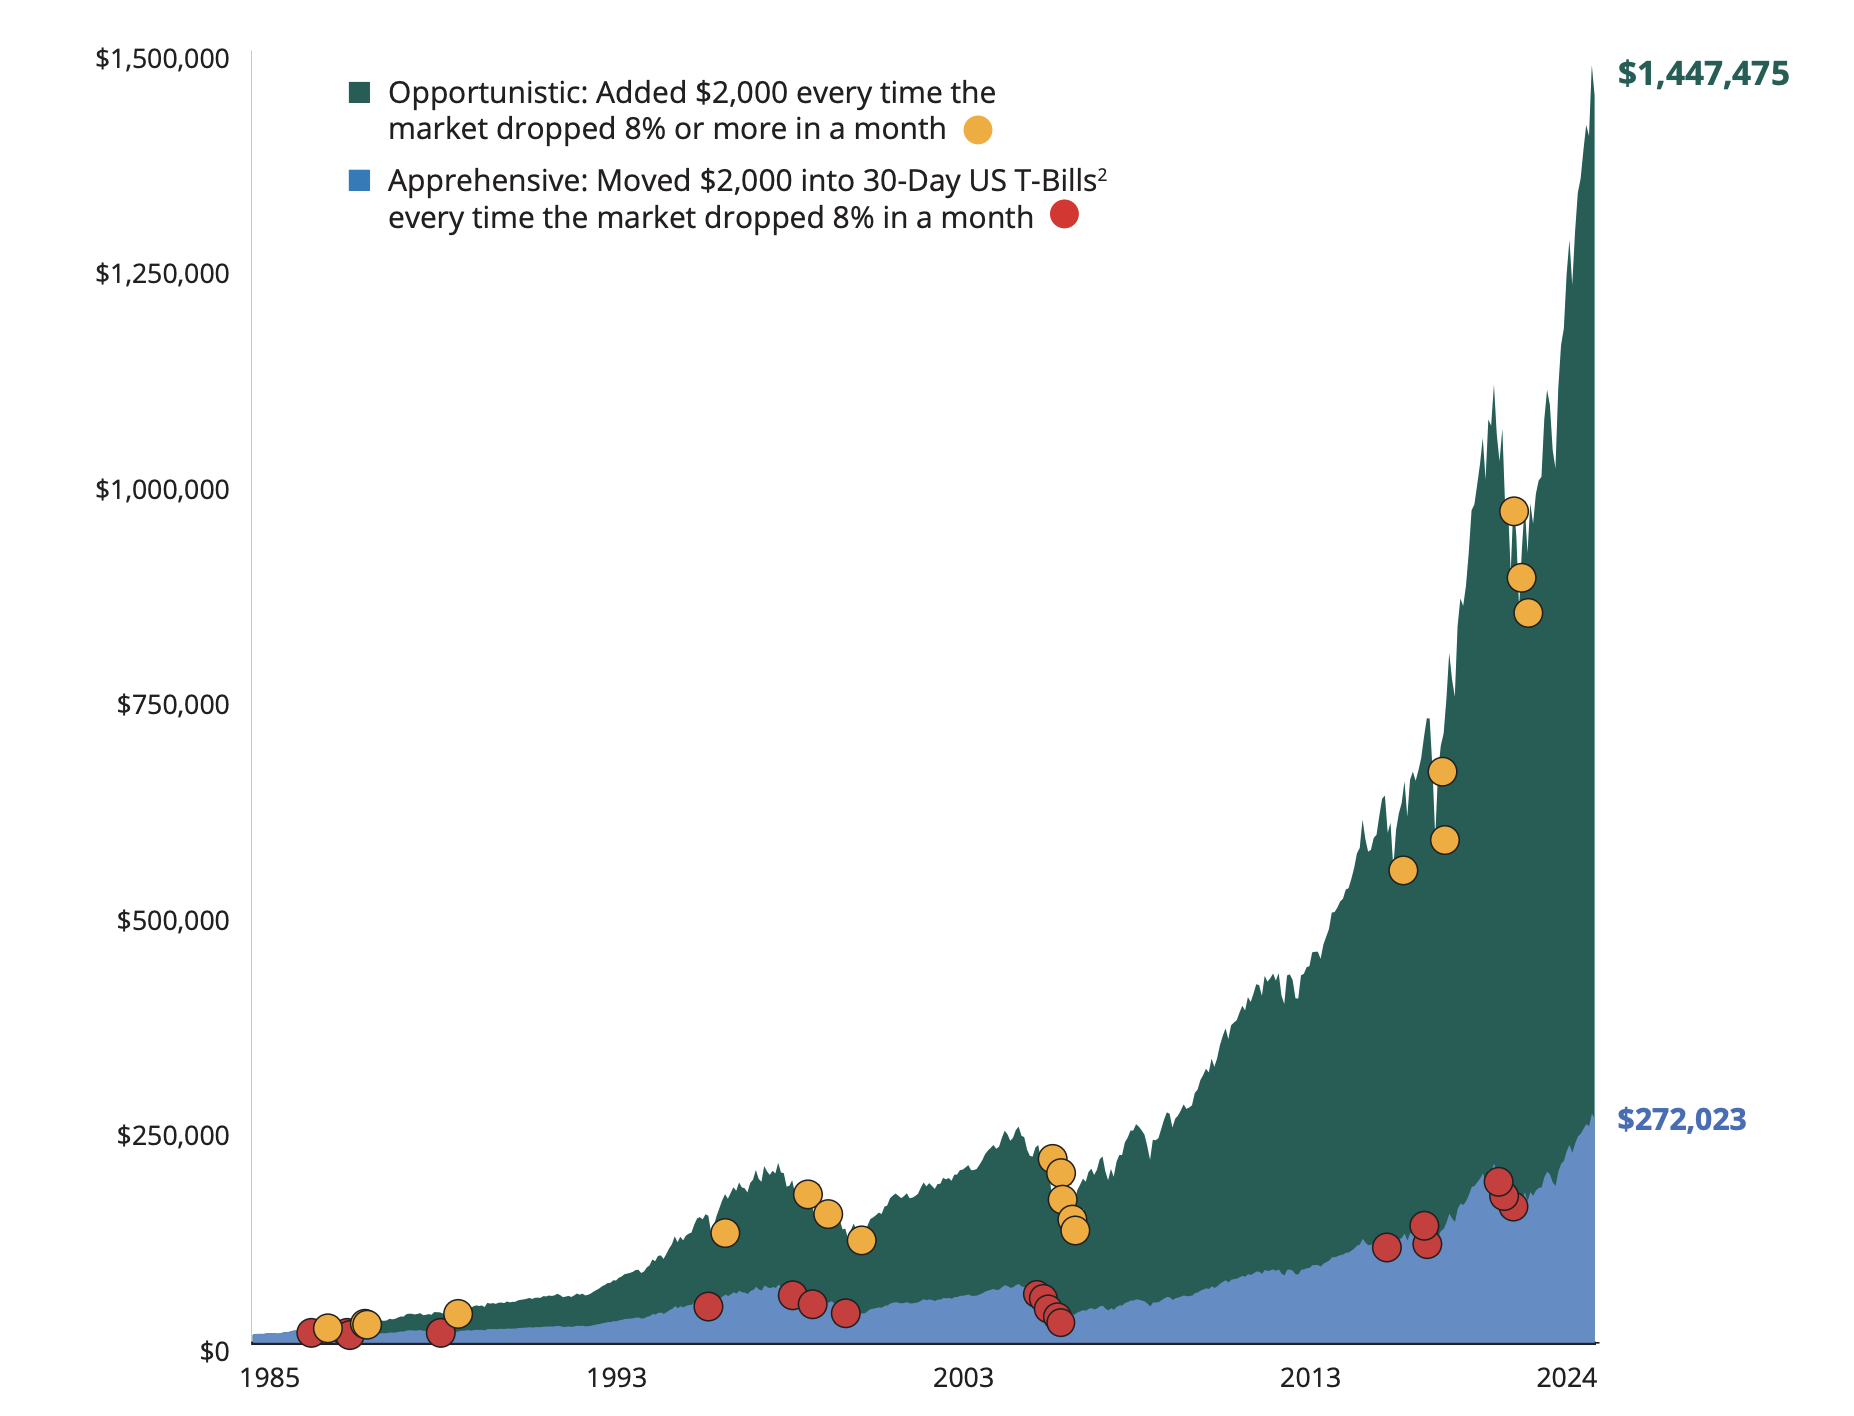
Sources: Morningstar and Hartford Funds, 2/25. Assumes no taxes or transaction costs.
What was the effect of two different historical approaches to volatility? Each assumes $10,000 invested on 12/31/84 into the S&P 500 Index; however, the opportunistic investor made additions when the market dropped, and the apprehensive investor shifted assets in the face of volatility. Ultimately, the opportunistic investor had a significantly higher investment value at the end. Investors should consider their financial ability to regularly make sizable investments during a prolonged market downturn.
Interest Rates May Become a Tailwind
One of the most important themes today is the shift in monetary policy:
- Inflation pressures appear to be easing
- Central banks, including the Federal Reserve, may have room to lower interest rates
- Lower rates could support equity valuations and corporate investment
That said, inflation and government debt remain real risks worth monitoring.
Valuations Matter More Than Ever
With certain areas of the market priced for total perfection, investors will want to be aware that:
- High equity valuations increase volatility.
- Concentrated portfolios are more exposed to market pullbacks.
- For example, you are likely more exposed to technology and AI than you realize if you're tracking via an S&P 500 index fund.
- Diversification remains one of the most effective risk-management tools.
In other words, how you invest over time is more important than simply staying invested.
AI Opportunity Expands Across the Economy: Opportunities & Risks
Hundreds of billions of dollars have flowed into AI in just a few years, driving rapid expansion across the economy. Long-term opportunities are emerging in three key areas: the AI technology stack, infrastructure and power, and companies using AI to boost productivity.
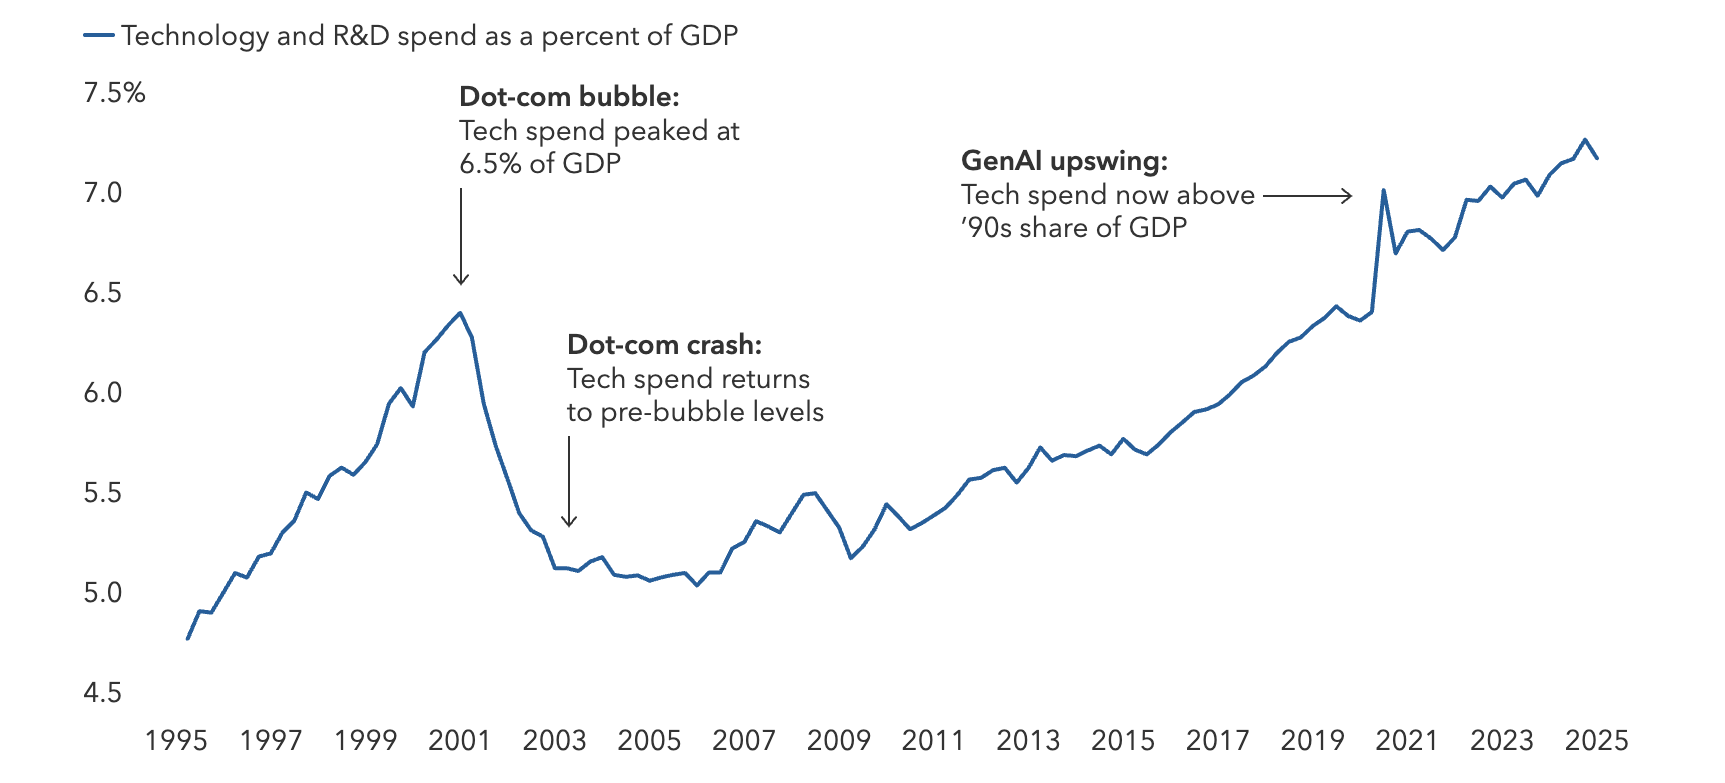
Sources: Capital Group, U.S. Census Bureau, Bureau of Economic Analysis, Haver Analytics. R&D is research and development. As of August 20, 2025.
Is Artificial Intelligence in a Boom, Bubble or Both? According to a recent analysis from Capital Group, "Today, stock prices for AI leaders are generally supported by solid earnings growth. What’s more, companies making aggressive AI-related investments, Alphabet, Amazon, Broadcom, Meta, Microsoft and NVIDIA, among others, can support their massive capital spending far better than the upstarts of the late 1990s."
Leaders Driving AI Spending:
- Microsoft, Alphabet, Meta: Large-scale investors with the capital to sustain aggressive AI investment
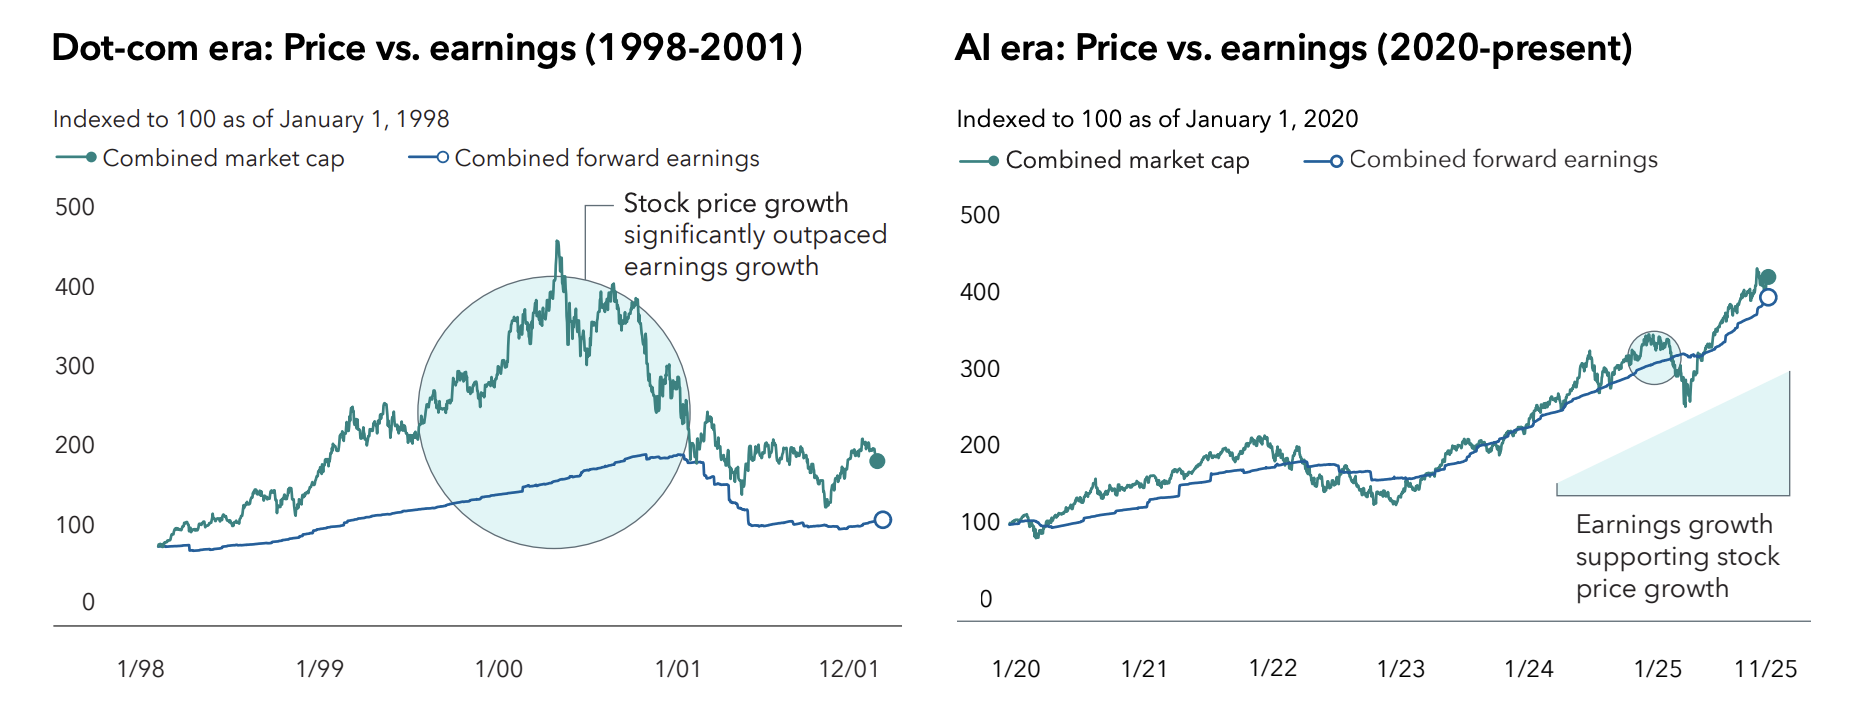
Sources: Capital Group, Bloomberg. Data aggregates forward 12-month net income (“forward earnings”) and market capitalization (“market cap”) for the “Four Horsemen” of the dot-com era: Microsoft, Cisco, Intel and Dell, four of the largest and best performing companies of that period. Indexed to 100 on January 1, 1998. Capital Group, Bloomberg. Data aggregates forward 12-month net income (“forward earnings”) and market capitalization (“market cap”) for NVIDIA, Microsoft, Apple, Amazon, Meta, Broadcom and Alphabet, seven of the largest AI-exposed companies. Data indexed to 100 on January 1, 2020. As of November 30, 2025. Past results are not predictive of results in future periods.
Power & Energy Tailwinds to Consider
- Rapidly rising AI power needs are creating demand for new energy sources
- Small modular nuclear reactors (SMRs) projected to reach $13.8B by 2032
- Continued demand for advanced semiconductors, cloud computing, and data infrastructure
Key Risks to AI Investors
- Financial Risks: Heavy capital spending could pressure earnings; high valuations increase downside risk.
- Obvious Operational Risks: Energy constraints or power shortages will slow AI deployment.
- Known Environmental & Social Risks: High energy consumption of AI data centers increases carbon footprint. Local communities or governments may restrict new data center construction. Regulatory pressure to reduce environmental impact could raise costs.
- Legal & Geopolitical Risks: AI adoption may be slowed by laws, trade restrictions, or conflicts.
- Competitive Risks: Rapid competition could reduce margins and differentiation.
Earnings Growth Beyond Big Tech
Corporate earnings could broaden, with growth coming from:
- Companies benefiting from capital spending and infrastructure
- Non-U.S. businesses positioned for cyclical recovery
This earnings expansion could support markets even if headline growth slows.
How Dividend Income Can Cushion Portfolios in Choppy Markets
Over the past 20 years, when the S&P 500 fell, the Dividend Aristocrats Index did better by about 0.65% on average. During the tech bubble crash from 2000 to 2002, dividend-paying stocks had positive returns, while many tech stocks and the broader market lost money. AI is expected to keep shaping the economy, but market pullbacks are likely along the way. To manage risk, some investors balance AI exposure with dividend-paying companies in more defensive sectors. Dividend opportunities are also available across many industries and in markets outside the U.S.
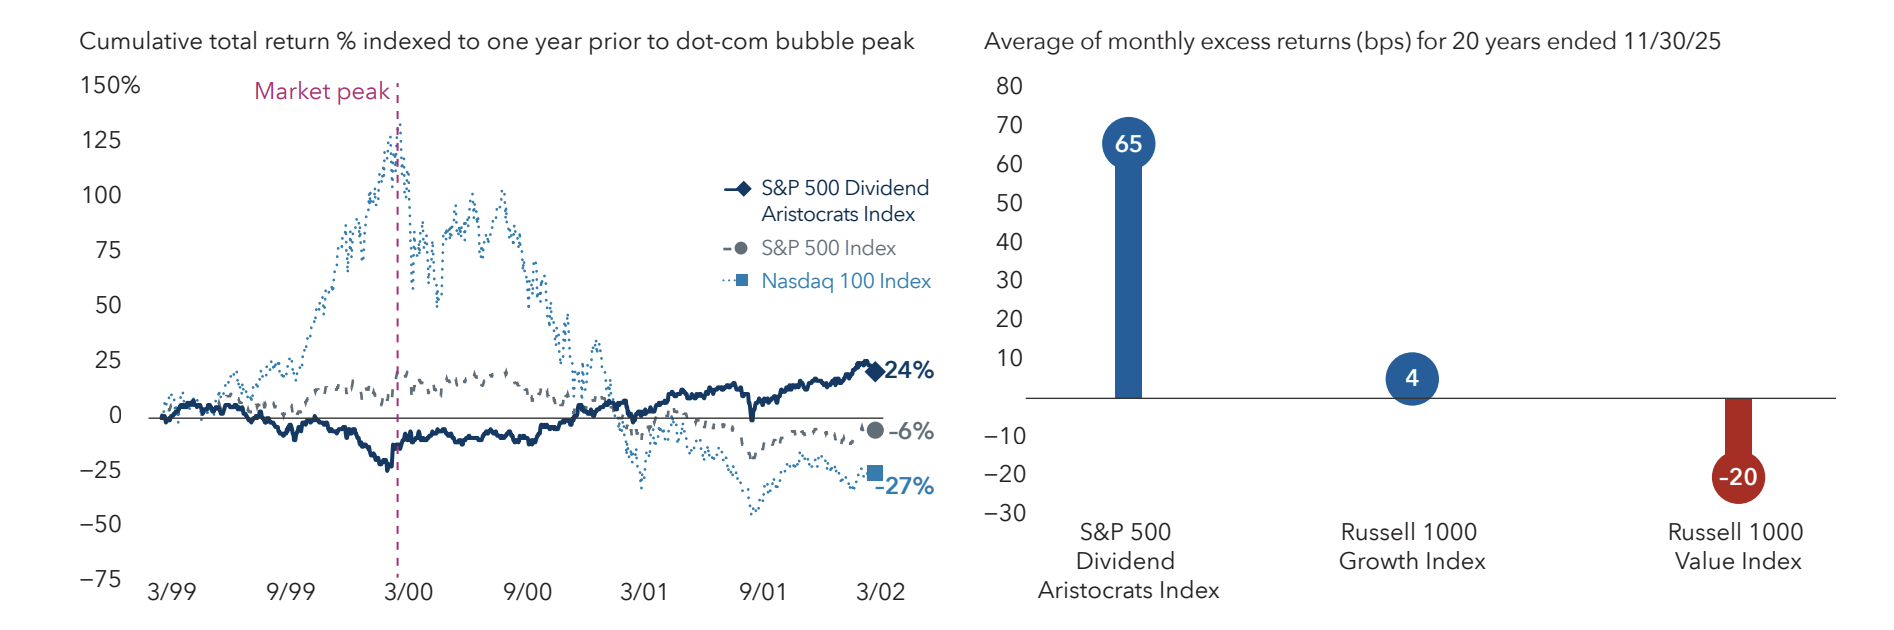
Sources: Capital Group, Bloomberg, Nasdaq, Standard & Poor’s. Dot-com bubble peak date used is March 24, 2000, the peak of the S&P 500 Index. Data shown is through March 24, 2002. Dividend payers are represented by the S&P 500 Dividend Aristocrats Index, which measures the performance of S&P 500 companies that have increased dividends the past 25 years. Capital Group, FTSE Russell, Morningstar, Standard & Poor’s. Figures reflect the average difference in monthly total returns between the index specified and the S&P 500 Index, across all months in which the S&P 500 Index had a negative return. As of November 30, 2025. Past results are not predictive of results in future periods.
A Long-Term Approach in a World of Short-Term New Cycles
For investors planning ahead, the next wave of opportunity will not come from chasing last year's returns or today's headlines, but from thoughtful positioning across a changing landscape. Those who stay globally diversified, valuation-aware, and patient will be better positioned for what comes next.